Showing posts with label relevance. Show all posts

05 October 2015

UnGoogleable Question - Oct 5, 2015

This question is not high on the "UnGoogleable" scale, but another important aspect of real questions for our students is that they are timely.

When freshman came in this morning talking about who all had been drinking over the weekend and embellishing stories of "the best way" to sober up, after taking a minute to get over my frustration/anger at the absurdity of the chatter, I wrote this problem on our whiteboard for their Do Now.

More than the math our kids can perform (which several kids "successfully" calculated to be 2.5), it matters who they are now and what they are becoming. I don't mean to imply that kids drinking at a party is the end of all sins, but I think it is important that my students know that I care about what they do when they aren't with me. I'm not a math robot, so I refuse to teach like one either. :)

30 April 2015

AP Stats at the STEM Expo

I moved up the timing of my statistical inference/experiment design test this spring (usually its the "capstone" project kids do as their final) so that we could participate in our district's STEM Expo tonight. (I think its really just the traditional science fair repackaged, but I'll go with it. LOL)

As I wrote a couple weeks ago, I enlisted the help of a doctoral student from Washington University to give some tips/insight on making and presenting their posters, and we spent the last 5 days of class working on our survey instruments, analyzing the results, and presenting them on a poster.

This is the first time these projects/experiments have ever had an audience beyond myself, so I'm really excited to see my students out in the "real world" talking about statistical inference. I literally had a student email me over the weekend and tell me she would change whatever I asked and do whatever I demanded so her poster could be perfect. You've gotta love that.

The NYU research poster guide and continued support from +Ryan Watkins ended up being a huge help, and after an assist from the CAD teacher downstairs, I'm real excited with how these posters turned out.


I had one student who could not make the Expo, so I had him present last week to our friends at another high school in our district in AP Chem.


There's always something special about seeing kids describe and defend their work that is better than most of the feedback that a teacher could ever give traditionally. They often find errors in their writing, their process, and bits that are confusing or could be more clearly explained as they try to sort out what their work SAYS with what it is actually supposed to be communicating.

We found a few errors in the graphical representations or calculations as we were sharing with parents at the Expo, but I was so thrilled that they found them and corrected the mistakes that I couldn't be anything but proud of them. If you'll notice the poster in the video, he has a lot less going on... he actually only did about half of the work, and I don't know if he noticed it until he got to the end of describing his methods after a couple minutes and didn't really have much to SAY about it - nothing to interpret. There's a verbal pause where (I hope) he realizes he's done, but shouldn't be.

13 April 2015

Does Major League Baseball Need a Stats Lesson?

I saw this data in the St. Louis Post-Dispatch last week claiming that the Cardinals are the 6th most expensive team  to see at their home park. (the "FCI" averages all of the columns from this chart together to get an estimate of what a family of 4 would expect to spend at the ballpark.)

I have no problem with the FCI, but I wonder if this chart's reporting of "MLB LEAGUE AVERAGE" is a little off. That row looked suspiciously in the middle to me, and when I counted rows, it was indeed exactly in the middle.


So what's going on here? Is it a misrepresentation of "average," do MLB teams attempt to group themselves symmetrically around this figure, or is it pure coincidence?

Here's the MEAN of those FCI listings by team:

Could the difference between 211.68 (reported in the table as "average") and my calculation of 211.89 be the result of rounding error in the data they used that I don't have access to in this report? Are there 21 rogue cents floating around in their numbers? 


What's this mean for my students?
I think this graphic and table is a good conversation starter for both mean vs. median AND the role of rounding in getting "different" answers. What's the clue that this CAN'T POSSIBLY be the median? Its not listed in the data of course. 

19 March 2015

NCAA Tourney Simulation 2015

Following a process similar to last year's, I used the fan picks on Yahoo Fantasy Pick 'Em as a "true proportion," assigned integers according to those percentages for each team, and then used the randInt( function on my TI-84 to generate a number.

As an example, in the 2nd round game of Butler vs Texas, I assigned the numbers 1-60 to Butler (as the higher seed), and 61-100 to Texas. The number generated was between 1 and 60, so I chose Butler.


This year's simulation had Arizona upsetting Kentucky in the Final Four and Duke taking the championship in the final.

Here's the whole simulated bracket. Click the image for a larger view.


12 February 2015

What Do 42 Educators Think Is Wrong With Math Class?

At the beginning of my 3-Act Math Stories presentation today at METC, I prepped the audience to watch the beginning of Dan Meyer's TedTalk from 2010 by reflecting on what they felt was wrong with math class.

The prompt: "What do you think makes it so hard for our kids to be independent, competent problem-solvers in our math classes?"

I had them share their responses in a very low-tech method of throwing the paper wads to the front. Some of the audience enjoyed hitting me with their paper a little too much, I think. ;) Its an engaging strategy, but then you have to do all of the de-crumpling. LOL.
So what DO 42 educators at an education technology conference have to say about the problem with math class? I put together a few word clouds on Tagul, ABCya!, and WordItOut of their responses to pull out the themes.


Here are the themes I pulled from this cloud and the responses as I read them:

  • Our students lack confidence as problem-solvers and mathematicians
  • Our students fear being wrong
  • Many of our students don't want to think
  • Our students lack basic skills (which makes even simple approaches to problems difficult)
How do we get past these challenges? One problem I see to the solution is that "confidence as problem solvers" and "lacking basic skills" seem like problems that usually have divergent solutions. To build students' confidence as problem solvers, it takes the time and opportunity of giving them safe chances to fail, reflect, and improve their approaches. To build basic skills, there must be at least some layer of kill-and-drill practice. How do we do both? I only see this as possible when we double up kids' math classes. (which can have its own motivational problems).

What can you add? What's wrong with math class?

10 February 2015

Engaging Your Students With 3-Act Math Stories

You want your students engaged and invested in the math work they're doing, right?

Are sweating common core-style performance events that require kids to go make decisions about what information they need, and then successfully gather that info?

Are you looking for something more memorable to do with your students than "page 412, #34"?

Enter 3-Act Math Stories, a collection of open-ended, perplexing math stories (think of it as a word problem with all of the structure stripped away). The movement was begun and is being led by +Dan Meyer

3-Act Stories are what have me most excited curricularly in math this year, so when given a chance to put together something for METC this year, I knew that's what I was going to choose.


Links 3-Act Math Stories:
101qs.com - Dan Meyer created site to manage crowdsourcing creation of stories
threeacts.mrmeyer.com - Google Sheet of Dan Meyer (and others) stories aligned to CCSS standards
Three Acts Livebinder - Popular stories, reading and videos for training teachers

16 January 2015

Algebra on a Chromebook: Google Search Math Tricks

claimtoken-54bd0c7a5d4dc
Need a calculator?
Need a graphing calculator?
Need a unit converter?
Need to calculate a volume?
Need to calculate an area?
Need to find the measurement of the side of a shape, given one of its volume or area?

Your students (and you) can use Google Search to perform all of those tasks without ever leaving the browser window. Does it take the place of having a standard, standalone, scientific calculator? Of course not.

However, knowing these Google search math tricks help me to work more efficiently when I'm in the flow of a project. Having a browser window open is ubiquitous to the modern computer experience, so as often as possible, it makes a lot of sense to me to utilize what I've already got open and available. If I can perform the task without going to a specific online calculator or grabbing my physical calculator, it just makes sense.

So what all can I do?
1. Perform calculations the same way you might on a handheld calculator.
You can even do square roots or logs if you know the proper notation.


2. Graph equations of functions. 
Include a comma between equations to do more than one. Trace for specific values by hovering your mouse cursor over the function.


3. Calculate the volume or surface area of a 3D solid. 
Just type in volume formula of _________. Cone is shown here, but also works with cylinders, prisms, spheres, and pyramids.


4. Calculate the area of a 2D shape. 
If you only search, "area of _______," it will return the formula and give you a text field to enter your dimensions, but you can also specify a dimension in the search. In the example below, I specified a radius of 4 by including "r=___"


5. Convert units 
This is super important for project-based learning, "real-world" problems, or gathering information for 3-act math stories.

The drop-down menu that is currently on "digital storage" below also has options for temperature, length, mass, speed, volume, area, fuel consumption, and time units.

18 December 2014

Big Macs are NOT Commutative

I went to a St. Louis Blues game with a friend recently and the team scored 4 or more goals, so everyone with a ticket stub got a free McDonald's Big Mac the next day!

When I got my Big Mac back to the math office for lunch, I opened the carton to discover that on top of my sandwich was two consecutive pieces of bread. It looked a lot like this:

source: smosh.com
Besides relevance in assembling nearly anything, many creative processes, and computer programming, order of operations is even important in our branded food products. Who wants that much bread? :)

I showed it to my friend who had stayed behind and his reply was inspiring.
"Big Macs are NOT commutative."
This image will be posted in my classroom as a playful reminder to always be considerate of those operation rules.


17 December 2014

Bowling in the Living Room

The older my daughter gets, the more I continue to be amazed at what she's capable of doing (and inspired by what my wife comes up to do with her) during home-school time.

On a random week-day this past September, my 4 year old tracked and generated her own color-coded data chart. This is especially profound for me today because I just got back my semester evals in AP Stats and a couple kids said that the times I sent them out to collect (and then use) their own data were some of the very best, most relevant lessons.

So, my wife could have picked up some colored balls or marbles and counted them in some repeated fashion that my daughter then notated on the chart she was given, but instead, they went bowling in the living room.

A simple toy bowling set we bought a couple of years ago, set up in the living room.

That face... LOL

Which pins did you knock down?

Counting the number of pins after all the trials, then drawing an illustration in her science notebook
This post probably isn't actually for teachers in an early ed or primary classroom. From all of my interactions observing my son's classroom and others in the district I teach, no one has to tell early ed and primary teachers that physical activity and tangible, concrete objects and experiences are critical to students' engagement in and memory of the content they are responsible for learning.

If you are an early ed/primary classroom teacher, let me just continue to encourage you in all of your work encouraging and promoting numerical literacy. Creating and interpreting charts to track, present, and understand data becomes more important year after year as companies increasingly use computers to track data on customer's preferences and habits, waste or excess in financial statements, student achievement on state tests (and how/why they are rising/falling), just to name a few.

If you're a part of my usual audience of middle school and high school teachers, my hope is that you'll take the same lesson I often take myself when I observe my daughter's learning - kids always start out eager to learn. They start out eager to take experiences from play and translate them into a different medium to make sense of what they just did. When everything is new, few things are "boring."

Here's my lesson from today, courtesy of Hey, Beth Baker:

  1. Involve your students in creating as often as possible.
  2. Take some time out of class to do something. 
  3. Keep pushing and seeking exactly what your students are capable of. If its something their passionate about, they'll probably surprise you.
  4. Use the normal or mundane things around you in a new way to surprise your students and bring them in.


16 December 2014

Algebra on a Chromebook: Coding with Bootstrap

Have you ever wanted to code in the classroom to integrate more STEM projects, but felt tied into making sure you hit all your required curriculum?


Bootstrap (www.bootstrapworld.org) is a complete curricular resource for math teachers who want to integrate coding into their algebra instruction and computer science teachers who want to integrate and support their students' math learning.  Students learn the logic and spatial reasoning necessary to translate into "real" coding languages while working with operations, functions, and the coordinate plane. It's a real two-for-one!

What Will I Find?
The Bootstrap website has everything you will need to implement the Bootstrap curriculum in your Algebra 1 class (except for the technology hardware, of course)
  1. Student workbook (and teacher edition)
  2. Unit pages for students to follow through and fill in their workbook
  3. WeScheme online coding environment (this is called an IDE, for "integrated development environment," which just means, "this is where you write the code for your website or webapp.")
  4. Alignment to common core standards
  5. Teacher notes (displayed on the same page students use to read instructional content)
  6. Professional development videos to help you understand coding-specific words or processes before you have to share with your class.
How Will My Students Do This on Their Chromebooks?
Some of the work in the Bootstrap units will take place in the online modules, some will be handwritten on paper or whiteboards, and some will be in an IDE like WeScheme (when kids are building their projects)

In other words, students will use their Chromebooks for viewing lesson content, collaborating, and writing their code. 

Why Should I Do This Instead of Focusing on Raising Tests Scores? Accreditation is Very Important for Us.
I believe this question can be answered with three more. How's your more traditional curriculum working for all of your student? Is everyone mastering the Algebra content? Are your students learning content for a test, or are you giving them a vision for something more?

In my personal experience, the number of students that come into my Algebra 1 class that are being successful in "normal" classes continues to fall. We still have students that can excel in those environments and can play the school game, but I see a growing divide between those and the others. Going through the laundry list of things our district is trying to target, the bootstrap curriculum gives me opportunity to still do plenty in reading technical content, writing for assessment and understanding, and providing engaging, relevant work.

How Else Could I Sell This to My Administrator and My Colleagues?
Here are some talking points that should cover most of your bases-
  • "The units are aligned to the common core."
  • "Students will have an end product to demonstrate their learning at the end of the semester."
  • "They provide a pre and post test to gather data on the curriculum's effectiveness."
  • "Coding is a highly relevant and marketable skill for getting our students college and career-ready."
  • "Feel free to come visit and ask my kids about their work at any time. :)"

Is the Bootstrap curriculum for everyone? Maybe not - if you have no interest in coding yourself, then I think you would have a hard time getting your students passionate about learning themselves. Some students are just as averse to "new" or "different" in education as your teaching colleagues, so you'll need to be sold on the idea yourself to get them on board. That's not to say you already need to know everything about coding. The teacher notes are very helpful, and I went from totally confused to amazed at the idea of "circles of evaluation" and how they can help increase my students' UNDERSTANDING of the process and necessity of order of operations.


01 December 2014

3 Act Math Story - AP Stats - Ferguson Protestors

We're discussing sampling techniques in AP Stats right now, and I think a lot has been discussed in conventional and social media since the August 9th shooting of Michael Brown about the "real" Ferguson.

I teach in the district covering Ferguson, MO, so I've had students in my classes that I'm sure can identify with the popular claim, "I am Mike Brown."

I ran across this article in the NY Post over the weekend criticizing CNN's reporting of the looting, violence, and arson following the grand jury decision on November 24th.


The question that comes to mind first when I see this image paired with this headline is, "Well, how would we know?" There are so many variables playing into reporting of the protests. Who is "from" Ferguson? What is the line between "peaceful" and "violent"? Because St. Louis County is so fragmented with numerous municipalities, is there a big difference between being "from" Ferguson and being "from" one of the numerous small cities/villages/towns that border the Ferguson city limits?

Who's "more" of a part of Ferguson, the demonstrators at night or the people that come to clean up in the morning?

As I included in the teacher notes of this story when I posted on 101qs.com, I don't know if there is an "answer" to this question, but I think its a fantastic opportunity to talk about representative sampling, potential bias, and thinking through demographic and survey data that would be relevant in painting the most "real" picture of the attitudes of Ferguson residents.

The story on 101qs with aligned common core standards and accompanying questions, notes, and resources is here:

Evaluating as a 3-Act Story
  • The image-headline combo is great for getting a reaction or response from students (perhaps too much in my specific case).
  • The question is open-ended and there are several avenues students could take to support or refute the claim made by they New York Post writer.
  • I included several potential resources, including the link to the nypost.com story, census bureau quick facts for Ferguson, MO, a survey report from May 2014 evaluating the effectiveness of government services, and a map of Ferguson breaking down the wards. There are probably a few other data sources kids might need depending what path they go down, but from the teacher perspective of someone else using it in their classroom, I think its quite useful.
  • Since there's not a specific, black-and-white answer, there isn't a lot of closure. I could include a video of Ferguson residents actually peacefully demonstrating, or the dozens and dozens of volunteers that have helped clean up day after day, but that's not as rewarding as "here's the answer. Ta-da!"

In closing I would ask you to rate by the simplest barometer of success for a 3-Act Math story: Is this "perplexing?"

18 November 2014

How Do You Define a "Calculator"?

As our technology shifts from being based on hardware (music player, camera, "computer," telephone, datebook, notebook) to based around software (all of those things living on your smartphone or tablet), we've also seen a shift in the tech capacity of our classrooms.

Humor me for a moment and tell me this - which of the following are "calculators?"

All images under Creative Commons license
Did I surprise you with any of those choices? There is probably some debate between #6-8, and the thought of 1 and 2 being very useful to you might be amusing, but my point is that what we call "calculator" has evolved to match the power of our technology. 

Most everyone I teach with grew up with access to a graphing calculator (even if it was a TI-81), so its quite natural to have your students use it in the same way, but there was a lot of debate in the 80s about whether or not kids should be using calculators, and then again in the 90s about kids using graphing calculators. 

To me, the next phase in this discussion is the use of physical calculators with algebra solvers or apps like PhotoMath (which I wrote about here) or HomeworkSolver (picture above as #8).


Similar to how students hover over the problem with their device's camera in PhotoMath and identical to how a student would use Wolfram Alpha, students enter the equation to be solved and what is returned to them is a step-by-step solution that gives them the value of the variable.

I found a kid using this app a couple of weeks ago while he was working on practice solving some level of inequalities. The discussion went something like this after he came to show me all of his answers.

"I'm done, Mr. Baker"
"Cool. Next time, do that all by yourself."
"What do you mean? I did do this!"
"Nah, man. I watched you over their on your phone looking at the answers."
"This is just a calculator!"
"No, calculators just do things like 9*6=54"
"You CAN do that on here." [which wasn't a lie]

I was kind of stuck. He was right. I finished with what I feel like is a cop-out answer: "Well, you can't use that in here." That's fine that I set that rule for class, and I am responsible for making sure this kid can solve an equation in Algebra 1, but it ignores the real debate.

What constitutes a "legal" calculator in your classroom? 

  • Is it scientific? (Better stop giving those order of operations problems, and operations with integers, then.)
  • Is it scientific with a muli-line display? (Don't assess your kids ability on fractions, then. Those have a fraction button. They also simply irrational numbers.)
  • Is it a graphing calculator? (Are kids "cheating" then if they use their calculator to produce a graph on their paper "by hand?")
Let's frame it in the context of our real job - which calculator best prepares our students for the "real-world" ahead of them?
If I'm answering that question for myself, the least I get to is to allow graphing calculators at all times, and I'm still on the fence about algebraic calculators. We need to change what we ask of kids in our curriculum, because we can't erase the technology.

23 October 2014

Special Right Triangles - Really?

What's in the list you keep (internally or physically) of things we still traditionally teach in our math courses that just feel "wrong" in 2014?

Memorizing formulas is probably one of my least favorite things, and I know I have that in common with my students, so wherever and whenever possible! I like to teach them the concept on a pattern level or with strategies that have more than one application. In other words, if the only reason for me to teach it is to maybe get lucky and steal a question or two on a test, then I usually won't stress it.

I was having a good week with my Applied Math class. The kids have been more or less focused recently, and we were all getting along. Kids love Pythagorean Theorem, for some reason. Right up there with "y=mx+b!" It's hard to find a kid who at least doesn't think they know how to use it. Taking advantage of those good vibes, I would have rather rolled on into circles, but the ugly special right triangles lesson stood in my way.

I went through the trouble of having them use Pythag the night before to actually solve the SRTs, and my first example showed them again how they can just use Pythag on any right triangle to find a third side. Good feelings were still flowing, and then our first question from the book had a 60 degree angle and ONE side. "Try and do THIS ONE with Pythagorean Theorem," it seemed to taunt me. I took the bait and walked the class through the relationships. And one by onem my confident students fell to the wayside, and my focused, eager students started to check out. 

So, why? Why invest time in a chunk of knowledge that isn't necessary if you know  Pythagorean Theorem or basic trig ratios?

Here's a note sheet I plan to share with my students tomorrow to articulate the alternatives again.

11 October 2014

2 Exercises for "Relevant" Proportion Solving in Algebra 1

One of the first things I realized after becoming a math teacher in my very first Algebra 1 summer school course was that students love to cross multiply. You stick a fraction on the board and ask something like, "Okay, what next," and you will most certainly get some kids that are dying to cross multiply.

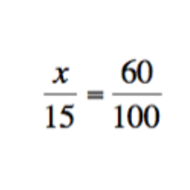
Kids that only know how to cross multiply love to get exercises like this:
And they're probably even pretty comfortable with this:


But things might start to fall apart sometimes when students have to set up the proportions themselves in a situation not neatly laid out for them in "word problem" format.

Here are two such attempts that I used in my Algebra 1 class this past week. One is about troop reduction in Afghanistan, and the other is about "total percentage of weight loss" and trying to win the reality show The Biggest Loser.


WAYS TO MODIFY THESE PROBLEMS:
  1. You could increase the rigor in both of these problems if you did not initially give either of the numbers I hand out (8000 and 51%, respectively) and instead, had your students figure out what number would be relevant to finding a solution that would satisfy the problem. After deciding what information was needed and/or relevant, students could do a web search to find the information for themselves. 
  2. Have an extension question exploring these ratios in a different way.
    1. The Afghanistan troop numbers could be compared to Iraq or previous deployments this century in Afghanistan.
    2. The Biggest Loser problem could ask students to compare Jerry to other seasons to see if he would have won those years. You could have students set up "teams" of Biggest Loser contestants and find the proportions of weight loss necessary to defeat other fantasy teams from previous Biggest Loser seasons.

11 September 2014

Declaring Racism "Over" Misses the Point for Students


My wife recently reshared this video from +FCKH8 on Facebook featuring children and teens from #Ferguson on the subject of racism and white privilege.

I actually didn't watch it until another friend had commented on the sharing from "Young Conservatives," who criticized the video for playing the race card, hypocritical claims, blame-shifting, and opportunistically "only" giving nearly 40% of the cost of the t-shirts they were selling to an organization fighting racism.

One of the most common reactions to "stop being racist," that I've seen is the declaration, "I'm colorblind. I don't see race. I treat everyone equally." I guess I get the point - this is probably often said with the best of intentions, but I believe its ignorant and naive.

It doesn't matter if white (and/or majority) people want to declare racism dead, if black (and/or other minority) people still believe they're experiencing racism. The best (because it was the hardest) lesson I've learned in my eight years of marriage is that the intentions or rationality of your actions and words matter less to someone else than your tone and the way they perceive your actions and words. "Perception is reality," my wife would calmly remind me later, after the hurt had subsided.

To say to your students that the color of their skin (and their experience in that skin) doesn't matter to you or isn't at least a consideration in the way you build relationships or consider relevance for your lessons is to belittle a part of their identity.

If your students identify with Mike Brown because he looks like them, then they identify with his story, too. You don't have to understand it, you just have to feel it. Listen to it. Let it happen.
This rings true across ethnicities. One of the least culturally responsive things I've done in the classroom occurred my 2nd year in summer school. I had about a dozen kids in an Algebra 1 class, I think consisting of all but one being African-American. Something I was proud of in that summer course was figuring out how effective making my kids take brain breaks could be. If the kids spent a good chunk of time on-task, they would get to nominate a song to be played while they did NO math for the duration. My white student was kind of disconnected from the school community in general, but the day I finally saw him feel a part of that class was on one of the last days of the session, when I forced a nomination out of him and we listened to some of his music. It happened to be "white" music (AC/DC), but the point was that in the name of being culturally responsive to the majority of the class, I burned the minority. Treating every student the same will always leave some students disconnected relationally. I never asked him directly, but even from observing his kid's demeanor, I could tell that his perception was that who he was didn't fit in with that classroom most of the summer.

Here's what I think you have to understand if you feel offended by this video - as long as some of your students perceive that the educational (and real world) experience will be different for them because of their race, you have a responsibility to at least acknowledge that racism might still be "a thing."

02 September 2014

You Should Sponsor the School Store (and Other Cockamamy Ideas)

"How come we don't have a school store, Mr. Baker?"
A senior came into class this morning, frustrated that she needed a notebook or something, yet legitimately had not been able to get it.

"Well..."
This was it - my chance to shut her down and focus on performing rotations on 2-dimensional shapes in the coordinate plane, or to grab this and run with it.
"That's a good question. I don't know. You should propose it to Dr. Hopper." I believe our building principal has a soft-spot for student-led initiatives, so I knew that a passionate plea, supported by a thoughtful written proposal had a shot.

"Hey, everyone," I got the class's attention. "Elle is proposing that we start up a school store, and we're looking for people to help with the proposal. Who's in?" A couple hands shot up, but they didn't know what they were actually volunteering for, so we settled on just one other student.

I spent the next couple minutes sharing our principal's contact info and outlining/facilitating aspects she would need to consider for their proposal. We got it to a "this baby is yours now; run with it" place, and resumed class, but I fully intend to return to this proposal if/whenever it comes up again.

"Tell Dr. Hopper, I will sponsor you," I told the school-store team. (Which sounds crazy for a father of 3 that's already on 3 committees and mentoring a first-year teacher). But I meant it. And not because I think they won't follow through.

We ache and plea for chances to inject "relevant" work into our math classes, and time to develop "real-world" problems to include in our unit instructional plans, but how often do we ignore the opportunities right in front of us because they might fail?
What would your students come up with?
Maybe the school store isn't going to be your students' idea, but I think this list applies to most ideas your students might need help getting off the ground. When you agree to come alongside a student-led initiative and mentor the process you're sowing a bountiful harvest of "teachable moments" and "relevance." Even if the school store idea doesn't go any further than writing the proposal, look what I'll already have the opportunity to model for my students:

  • Professional, formal writing
  • Organizational planning
  • Digital media creation
  • Collaboration
  • Budgeting
  • Problem solving (and anticipating new problems)
  • Figuring out what math fits into a given scenario and how it can support our case or help in another step of our plan
  • Revision/Draft process of writing

I have a motto for myself this year, and I made a sign that is taped outside my door: "I am an ally." A friend asked me last week what it meant, what was I fighting against. I told her, "I'm fighting for kids who need someone to care for them. Kids who need someone to listen. Kids who need an advocate. Kids who need someone to stand with them. I think its going to mean different things to different kids. I don't even have to agree with them all the time (USA and USSR in World War II, anyone?)."
I have no idea where this ally gig is going to lead the rest of this year, and no one else has even asked me about the sign, but if for no one else, I know, for MYSELF, that I committing to supporting cockamamy ideas as much as I have capacity for.

17 April 2014

Are The Chicago Cubs About to Be Historically Bad?

I have a student in one of my AP Stats sections that is a Cubs fan. Its usually a great opportunity to build relationship with him (and the others) by harassing him about how bad they are.

It's in good fun. And educational.

He was telling the class today about the Cubs 4-10 record through the first 14 games of the season. It sounds bad, and it is, but since we know significance tests now, I thought it'd be fun to through their preseason projected win percentage (.413) against their current (.286) to find the chances of a win percentage that low, assuming that the original .413 was close to correct.


Methods
1. Refer to preseason final standings projections from mlb.com to find the Cub's projection along with the other 30 MLB teams.

2. Find the standard deviation of all the team's projections using a spreadsheet.


3. Use the standard deviation of win percentage, projected win percentage, and current win percentage values to find the z-score and corresponding p-value on the normal curve. Our's calculated to .0015%. That's the likelihood of the Cubs having a win percentage that low, assuming the original projection was correct.

So what's happening here?
We probably shouldn't rule out that the Cubs could be worse than their projected win percentage, but with the team only 9% into the season, its certainly too small a sample size to declare that the team is headed to a historically poor season.


Supersize the Floorplan Area Project


Designing a floor plan to have students calculate and study area is pretty standard fare for a high school Geometry course, but the further we get into the CAD-era of drafting, the further it gets from relevance.

The only way I've ever seen this done is on grid poster board or with grid paper. It's good for modeling how someone might draft up an informal plan at the kitchen table or your workbench, but its completely unlike what "real" architects, engineers, and designers do at their desks. Your students might get some exposure in the career and technical ed department with the heavy tools from Autodesk, but there's no reason you can't get everyone a quick exposure from these free tools.

Google SketchUp

My students are in the middle of a project right now designing a water park for a fictitious town in southwest Missouri using SketchUp to lay out the 2D geometry, pulling up into 3D shapes, wrapping it with colors or images, and adding dimensions. You can add some pizzazz to your plan from the extensive 3D warehouse gallery of items contributed by SketchUp users.

I'm not mandating this for our purposes, but you can also add any text you want for identifying parts.

When you're done you can export your SketchUp to 3D printers or as images to be embedded anywhere else on the web.

How to get it:
SketchUp is available for download here for your personal use, but its software, so you'll have to wait for someone with admin privileges to install it for you at school. (I always hate coordinating this, so I stay away from locally installed apps whenever possible).

You can also run it with a browser plug-in from this link. I haven't tested that yet, but I imagine it might get slow at times. On the positive side, your students will be able to use it at home without having to install it on their own.


Autodesk Homestyler

Homestyler is marketed directly toward consumers wishing to design for their personal home or office. Therefore, there's less to offer to the "power" user, but its easier to pick up and use for your students that might be wary toward the technology aspect of your redesigned project.
My favorite parts of Homestyler:
  • When adding doors/windows/appliances to your model, beyond the generic options are brand name designs that you could specifically purchase at your favorite home improvement warehouse. 
    • Adding a budget or cost layer to your project because as simple as keeping a window open to homedepot.com or lowes.com
  • Exporting images AND interactive walkthroughs 
    • Users have a choice of several nature backdrops to have peeking behind any windows, and can even choose a setting to have the sun shine through. The point is to get a better feel for how a paint color would look in the afternoon sun of your actual home, but for your students' fake floor plans, it just adds an extra pop.
How to get it:
Not only is Homestyler free, but its also a web app, which means all your students need is the url to finish on their own at home. Launch the web app here. (requires Adobe Flash)

CONFUSION WARNING: There is also a Homestyler app in the iOS app store that has a completely different interface and functionality. The app directs the user to take a picture of the room they want to style and then add elements layered onto the image of that space. From a consumer standpoint, its a lot simpler than having to measure and layout your space like you do on the web app, but for the purposes of your floor plan area project, its useless.


Honorable Mention: Free, online tools that may also work for your project

RoomSketcher - looks a lot like Homestyler


14 April 2014

"Lying" to Your Students for Good - Crafting a Story to Engage Your Students


I'm lying to my students this week, and I think its okay.

Let me tell you about the town of Oklaville, MO...


If you're not from Missouri, you may not know, but "Oklaville, MO" is a completely fictional town that I created last week to hold a fake competition for designs for a community aquatic park. I created a relatively simple website in iWeb (but probably could have used Google Sites as well) and hosted it on Dropbox using these instructions.

This "design a water park project" is the marriage of something I've been wanting to do since February (use Google SketchUp for designing and area) and fixing a project that is never really as good as I want. The prompt for the design actually comes from my textbook -


The last two years when I had my students do this project, I gave them a clean sheet of 1cm x 1 cm graph paper, and it usually came back to me in a pretty rough draft that hopefully was not totally wrinkled. They were uninspiring to say the least, but maybe that wasn't completely the students' fault. Is there really a lot of sense in taking pride in a fake water park on a piece of paper that literally no one else but the teacher will see? I wanted them to look better for the sake of work ethic and pride in work, but honestly, I was kidding myself.

When the situation arose again this year, I knew it was time for something different. I just the last couple weeks spent many hours designing a website for my friend trying to launch a side-career in Gospel music, so I had design heavily on my mind.

Take a second to go back and peruse that site if you haven't yet - its three simple pages, but they look pretty legit, right? I included a "real" seal, an address for city hall, and a couple of examples. If you take 5 seconds to do a Google Map search for that address, or even Oklaville itself, you'd know it was fictional, so when/if my students get to that point, I'll easily fess up and tell them much of what I'm writing here.

Is it deceptive? Probably. It may be risky when I tie so much of my relationship building to honesty, but I'm really counting on the relationship we can build during this project as a serve as Google SketchUp mentor.

Is this for you? I don't know, but a colleague of mine pointed out all of the times she lies to her students when they ask her if something they do is going to be for a grade. We've probably all done that several times, but for what? A single piece of paper, 10 minutes worth of work? When you create worlds for your students' work, they can get real skills out of it.

Chuck's Tips for Lying To Students (for Relevance)
1. Take time to pay attention to the details. 
It's kind of like The Matrix - your students won't know things aren't real unless they are really looking for it.

2. Prepare multiple sources of "reality."
Besides the three pages I created for the website, I also registered a new Gmail address and crafted an official looking memo for another copy of the "proposal requirements"


3. Be non-chalant about everything
I showed this to all of my students today, but I pitched it briefly to just one student on Friday and was able to get him excited about it all weekend.

4. Have a real prize, reward, or recognition ready
Of course, there isn't a real Oklaville City Council waiting to vote on my students' submissions, but that isn't any reason why I can't make a big deal out of the best submission. Have a panel of your colleagues come in to judge once you let the students in on the secret. One student asked if he could have a medal if he wins. Sure!

5. Have fun.
The whole reason you're doing this is to bridge a gap between worksheets, bookwork, and teacher-driven assessment to something that is more authentic, more engaging, and more fun. Be creative in the setting you create, and cherish the enthusiastic conversations you have along the way.

20 March 2014

Simulating the NCAA Tourney with a Random Number Generator

It's "Big College Basketball Tournament" time, everybody!

(When I remember to get it in on time) sharing your bracket for the NCAA tourney is always an easy way to get conversations going with a lot of my students, which is especially good because right before Spring Break is when some of my students want to talk to me the least. :)

I did some research on building a "probabilities of the NCAA tournament" project a few years back, but it seemed kind of impossible, and not totally worth it when weighed against other curricular demands.

So, I scaled back expectations and started with having fun with it myself. Using the probabilities from the user picks on CBSSports.com's bracket manager, I simulated the outcome with a random number generator (from mathgoodies.com), and chose the victor from there.

BRIEFLY, MY PROCESS

Had this been the number generated for the game above between Oklahoma and North Dakota, OU would have been the winner because 33 is between 1 and 76.


RESULTS
To my pleasant surprise, the method produced a rather conventional bracket, while still making some fun, plausible upsets. As I'm writing, the first day's games are about half done, and the bracket is holding its own against most anyone else's.